Reef Education
What the index measures, what every symbol in the formula means, a full worked example you can follow line by line, and why two sites with exactly the same species can return very different numbers. Written by the marine biologists who run this as fieldwork on the Great Barrier Reef.
Simpson’s Diversity Index turns a list of counts into a single number between 0 and 1 that describes how diverse a community is. It appears in Unit 3 of Queensland Senior Biology, it is examinable, and it is one of the few pieces of ecology in the course where you can be asked to actually calculate something.
It is also frequently taught badly, because there are three different indexes with Simpson’s name on them and they behave in opposite directions. This guide sorts that out.
The short version
- Simpson’s Diversity Index measures diversity, which is richness and evenness combined — not just how many species are present.
- The Queensland syllabus formula is SDI = 1 − ( Σn(n−1) ÷ N(N−1) ).
- n is the number of individuals of one species. N is the total number of individuals of all species.
- The result runs from 0 to 1. Closer to 1 means more diverse.
- Two sites can hold identical species and identical totals and still score very differently, because evenness changes the answer.
Where this sits in the syllabus
Unit 3 of Queensland Senior Biology deals with biodiversity and the interconnectedness of life. Students are expected to determine the diversity of species using a range of measures — species richness, evenness or relative species abundance, percentage cover, percentage frequency, and Simpson’s Diversity Index.
Two things follow from that. It can be assessed in the external exam, so it has to be understood rather than memorised. And it is designed to be taught through an investigation, which means the data ideally comes from somewhere real.
The four measures, and how they differ
| Measure | What it tells you |
|---|---|
| Species richness | Simply how many different species are present. A count. It treats a species represented by one individual the same as one represented by a thousand. |
| Species evenness | How equally the individuals are spread across those species. Also called relative species abundance. High evenness means no single species dominates. |
| Percentage cover | The proportion of an area occupied by something — used for organisms you cannot count as individuals, such as hard coral, algae or seagrass. |
| Percentage frequency | The proportion of sample units (quadrats, segments) in which a species appears at all, regardless of how many there are. |
Simpson’s Diversity Index is not a fifth thing sitting alongside these. It is a way of combining the first two — richness and evenness — into one number.
The formula, symbol by symbol
n — the number of individuals of a single species. You will have one value of n for every species you recorded.
N — the total number of individuals across all species. Not the number of species. This is the single most common error in the whole calculation.
Σ — sigma, meaning “add up all of these”. You work out n(n−1) separately for each species, then total those results.
The 1 minus — this is what flips the index the right way round. Without it, the fraction measures dominance, where a bigger number means a less diverse community. Subtracting from 1 turns it into a measure of diversity, where a bigger number means more diverse.
What the fraction actually represents
The part inside the brackets is a probability: the chance that two individuals picked at random from the community turn out to be the same species. In a community dominated by one species that chance is high. In an even community it is low. Subtract it from 1 and you have the probability that two randomly chosen individuals are different species — which is a reasonable working definition of diversity.
Understanding it as a probability is worth the effort, because exam questions often ask you to interpret the number rather than just produce it.
A worked example, line by line
Here is a set of fish counts from a single 30-metre belt transect. Work through it with a calculator rather than reading past it.
| Species | n | n − 1 | n(n − 1) |
|---|---|---|---|
| Blue-green chromis | 42 | 41 | 1,722 |
| Sergeant major | 18 | 17 | 306 |
| Moon wrasse | 9 | 8 | 72 |
| Six-bar wrasse | 6 | 5 | 30 |
| Redfin butterflyfish | 4 | 3 | 12 |
| Coral trout | 1 | 0 | 0 |
| Total | N = 80 | Σ = 2,142 |
Step 1 — find N. Add every count: 42 + 18 + 9 + 6 + 4 + 1 = 80 individuals. Six species, but N is 80, not 6.
Step 2 — work out n(n−1) for each species. Multiply each count by one less than itself. The coral trout gives 1 × 0 = 0, which is correct and not a mistake. A species represented by a single individual cannot contribute to the chance of drawing two of the same species.
Step 3 — sum that column. 1,722 + 306 + 72 + 30 + 12 + 0 = 2,142.
Step 4 — work out N(N−1). 80 × 79 = 6,320.
Step 5 — divide. 2,142 ÷ 6,320 = 0.339.
Step 6 — subtract from 1. 1 − 0.339 = SDI = 0.66.
Keep your decimals until the end. Rounding the fraction to one decimal place before the final subtraction is a reliable way to lose marks. Carry at least three decimal places through the working and round only the final answer.
Why evenness changes everything
Now take a second transect with exactly the same six species and exactly the same total of 80 fish — but spread evenly instead of dominated by one schooling species.
| Species | n | n(n − 1) |
|---|---|---|
| Blue-green chromis | 14 | 182 |
| Sergeant major | 14 | 182 |
| Moon wrasse | 13 | 156 |
| Six-bar wrasse | 13 | 156 |
| Redfin butterflyfish | 13 | 156 |
| Coral trout | 13 | 156 |
| Total | N = 80 | Σ = 988 |
988 ÷ 6,320 = 0.156, so SDI = 1 − 0.156 = 0.84.
Same richness. Same sample size. Same species list. 0.66 against 0.84.
That gap is evenness, and it is the entire reason the index exists. Species richness alone would have called these two sites identical. If you can explain this comparison in your own words, you understand Simpson’s Diversity Index better than most people who can recite the formula.
Which Simpson’s? The three versions
This is where marks get lost. Three different indexes share the name and two of them run in opposite directions.
| Name | Formula | How to read it |
|---|---|---|
| Simpson’s Index (D) | Σn(n−1) ÷ N(N−1) | A dominance measure. Higher means less diverse. This is the bit inside the brackets. |
| Simpson’s Index of Diversity (1 − D)The one we use | 1 − ( Σn(n−1) ÷ N(N−1) ) | Runs 0 to 1. Higher means more diverse. This is the Queensland syllabus version. |
| Simpson’s Reciprocal Index (1 ÷ D) | 1 ÷ ( Σn(n−1) ÷ N(N−1) ) | Starts at 1 and rises. The maximum equals the number of species present. |
If a textbook, a website or a tutoring video gives you a Simpson’s answer that disagrees with yours, check which version it used before assuming you made an error. The syllabus formula is the middle one.
Collecting the data: the belt transect
An index is only as good as the counts behind it, and for mobile animals like reef fish the standard method is a belt transect.
-
Lay the transect line
A measured line is run along the habitat — 30 metres is common. It defines the length of your sample and makes the survey repeatable.
-
Define the belt width
You count everything within a fixed width of the line, for example 3 metres — 1.5 metres either side. Length × width gives you the area surveyed, which is what lets you compare sites fairly.
-
Swim it once, at a steady pace
Counting on a single controlled pass keeps the effort consistent and reduces the chance of recording the same fish twice as it moves around you.
-
Split the job up
One person cannot count everything on a busy reef. Dividing the work — commonly by fish size class, so one observer takes the small species and another the large — makes the data far more reliable than everybody trying to see everything.
-
Record as you go
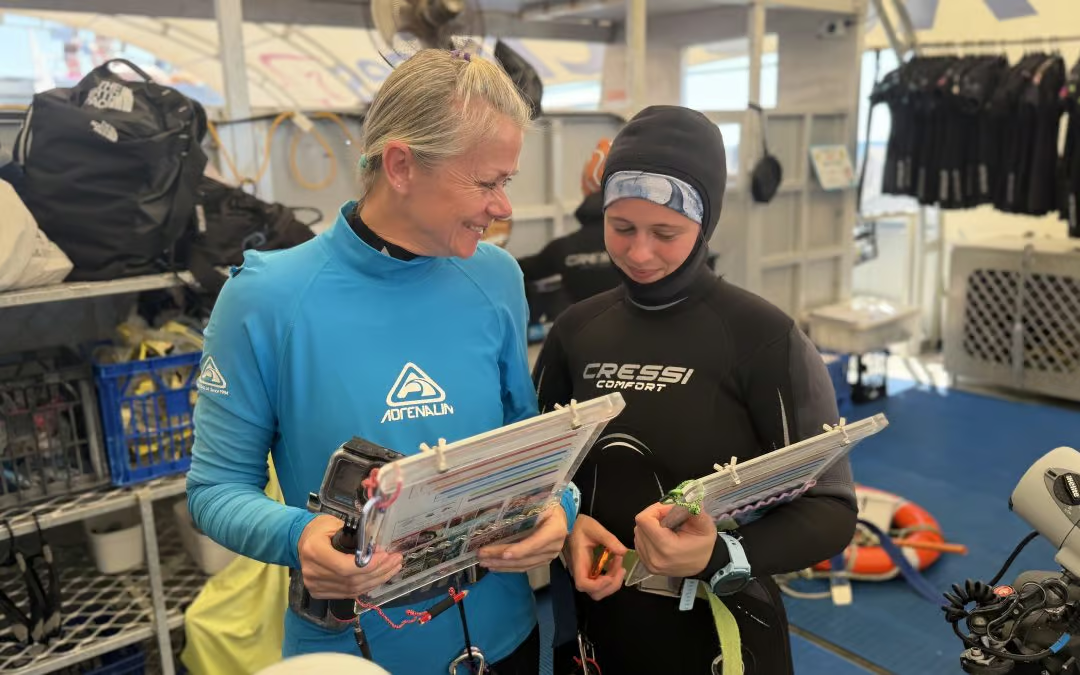
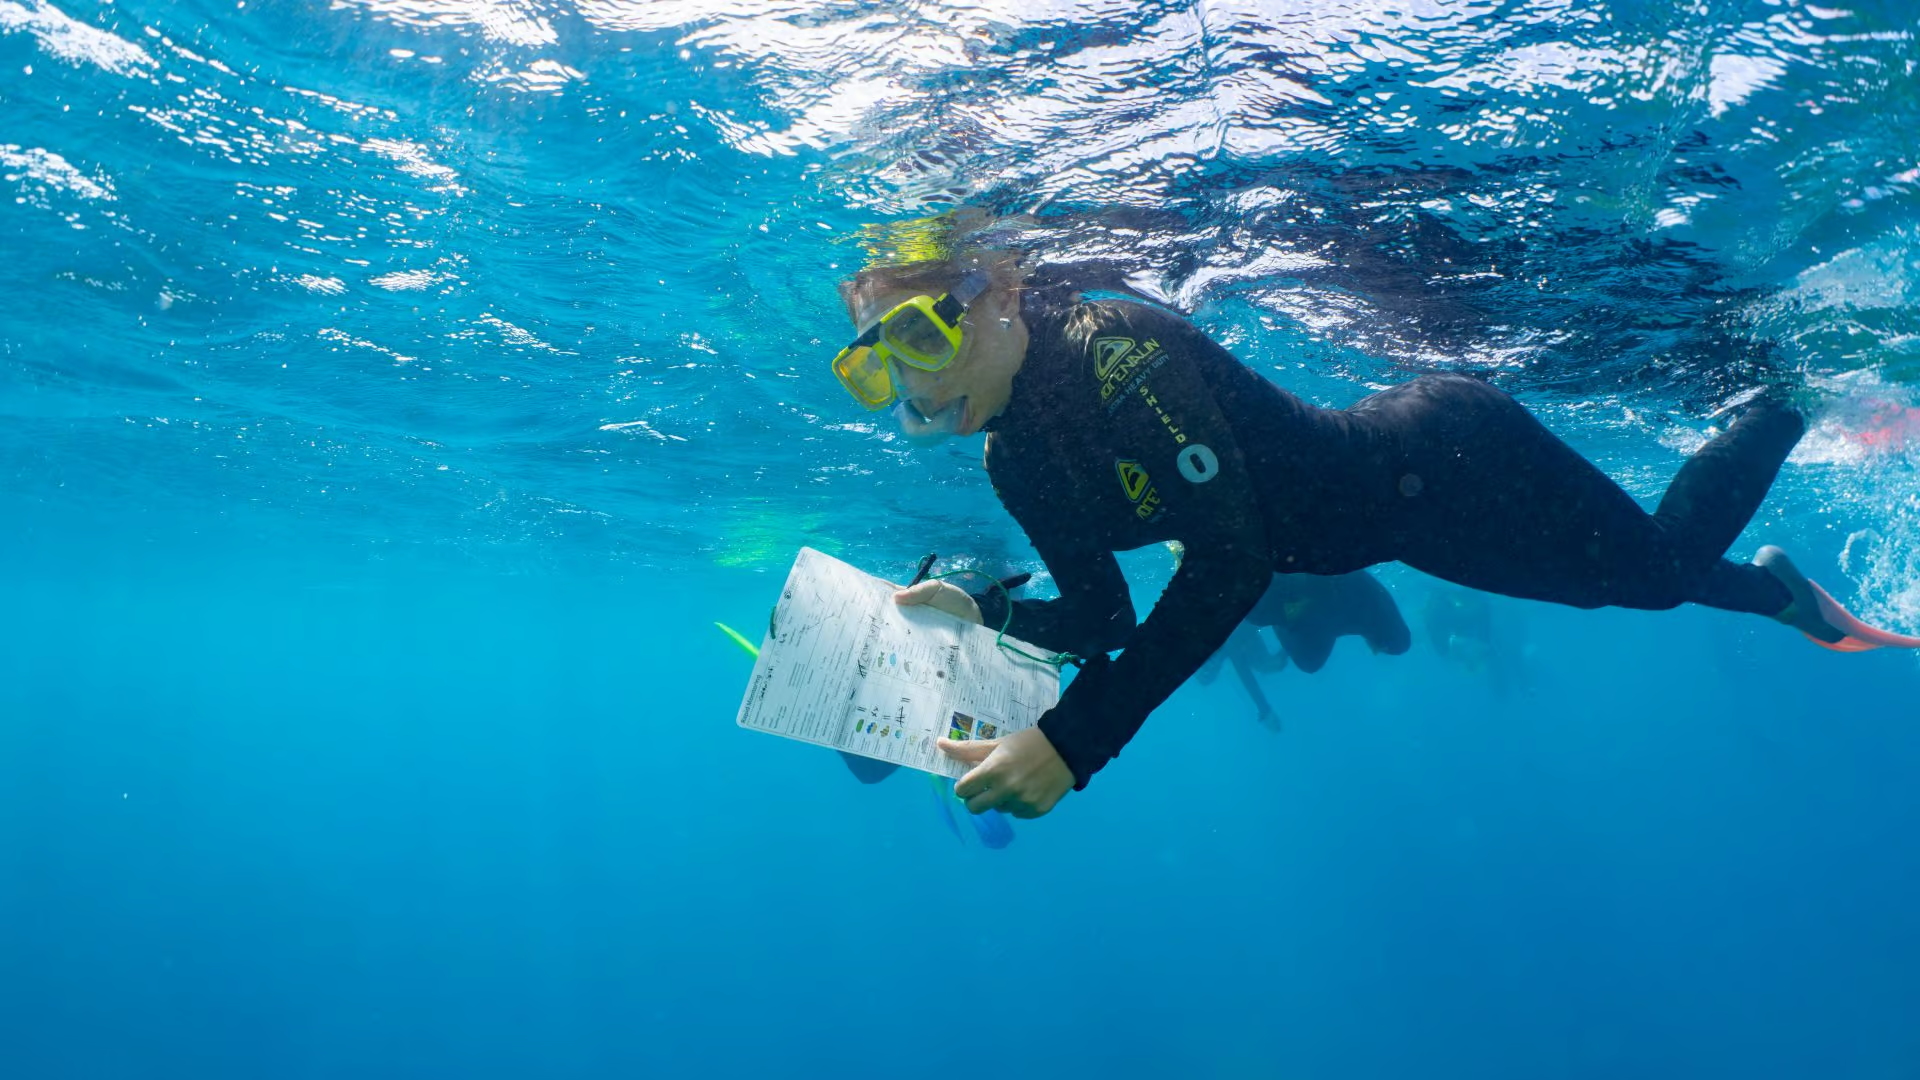
Data goes onto a dive slate in the water, not from memory afterwards. Species, tally, and the conditions at the time.
Why your field data will not be tidy
Textbook datasets are clean. Real reef data is not, and examiners like asking why. These are the factors that genuinely shift a reef fish result.
Schooling behaviour
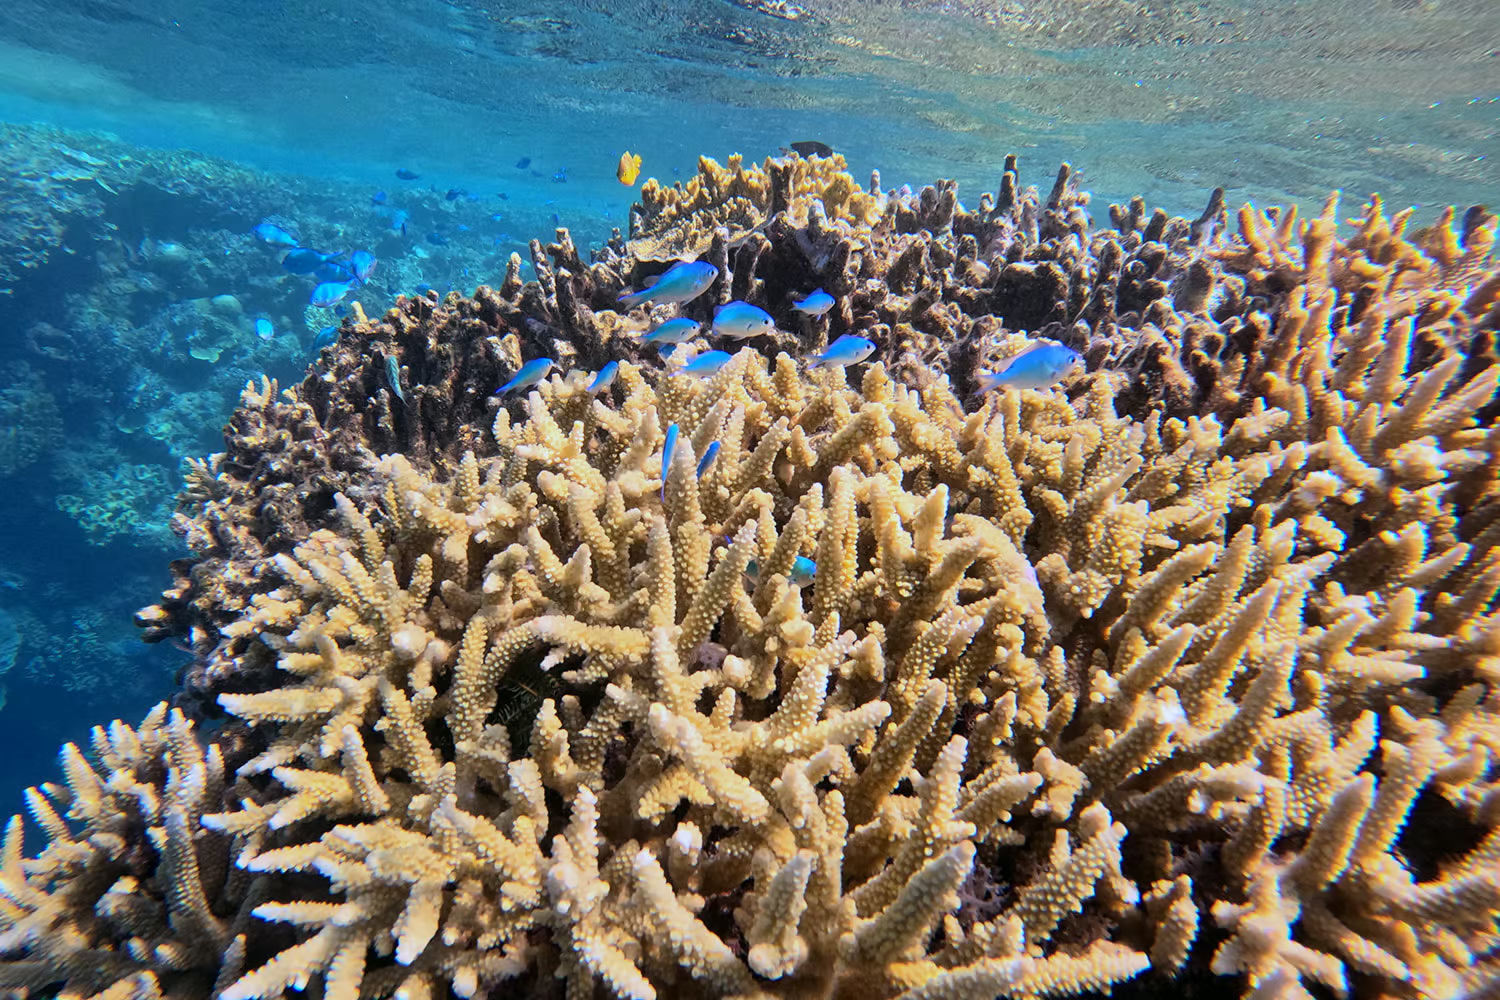
A single school of damselfish or fusiliers can dominate a transect and drive evenness — and therefore the index — sharply down, without anything being wrong with the reef.
Effect on SDILowers it, sometimes sharply
Predators are naturally rare
Ecological pyramids mean large predators are always in low numbers. A transect with one coral trout is not a sampling failure; it is what a food web looks like.
Effect on SDINone — this is a real result, not an error
What you can and cannot see
Cryptic, small or well-camouflaged species are undercounted; bold, brightly coloured ones are not. On top of that, wary species move away from snorkellers while curious ones move toward them. Both biases land on the count before any maths happens.
Effect on SDIUsually lowers it, by hiding rare species
When and where you sampled
Fish activity changes across the day and with the tide, and visibility changes what you can see. Reef flat, reef slope and bommie hold different communities, so transect placement matters — and a small N makes the index unstable, because a handful of extra fish can move the result noticeably.
Effect on SDIEither direction — two honest samples will disagree
None of this makes the exercise invalid. It makes it science. Being able to name your limitations and say which direction they pushed your result is exactly what a good investigation report does.
Common mistakes
Using the number of species as N
N is the total number of individuals. In the worked example above, N is 80, not 6. This single error produces a wildly wrong answer and it is the most frequent one by a distance.
Reading the index backwards
With the syllabus formula (1 − D), a higher number means more diversity. If you calculate 0.84 and describe it as low diversity, you have confused it with Simpson’s Index (D), where high does mean low diversity.
Treating a species with one individual as an error
n(n−1) = 1 × 0 = 0 is the correct contribution for a singleton. It still counts toward N and still adds to species richness. Do not delete it from your table.
Rounding too early
Round only the final answer. Rounding the fraction before subtracting from 1 changes the result and costs marks in working.
Mixing data types
This formula needs counts of individuals. Percentage cover data — for coral or algae — cannot be substituted into it. If you are measuring cover, you are using a different tool for a different job.
Quoting a unit
Simpson’s Diversity Index is a ratio and has no units. Write 0.66, not 0.66 fish or 0.66 species.
Interpreting your answer
Resist the urge to look for a fixed scale where a particular number means “healthy”. The index is most useful as a comparison — between two sites, between two habitats, or between the same site at two points in time, sampled the same way with the same effort.
A defensible interpretation says what the number is, what it means in terms of richness and evenness, what it is being compared against, and what could have influenced it. A weak interpretation just says “0.66 is a moderately high diversity” and stops.
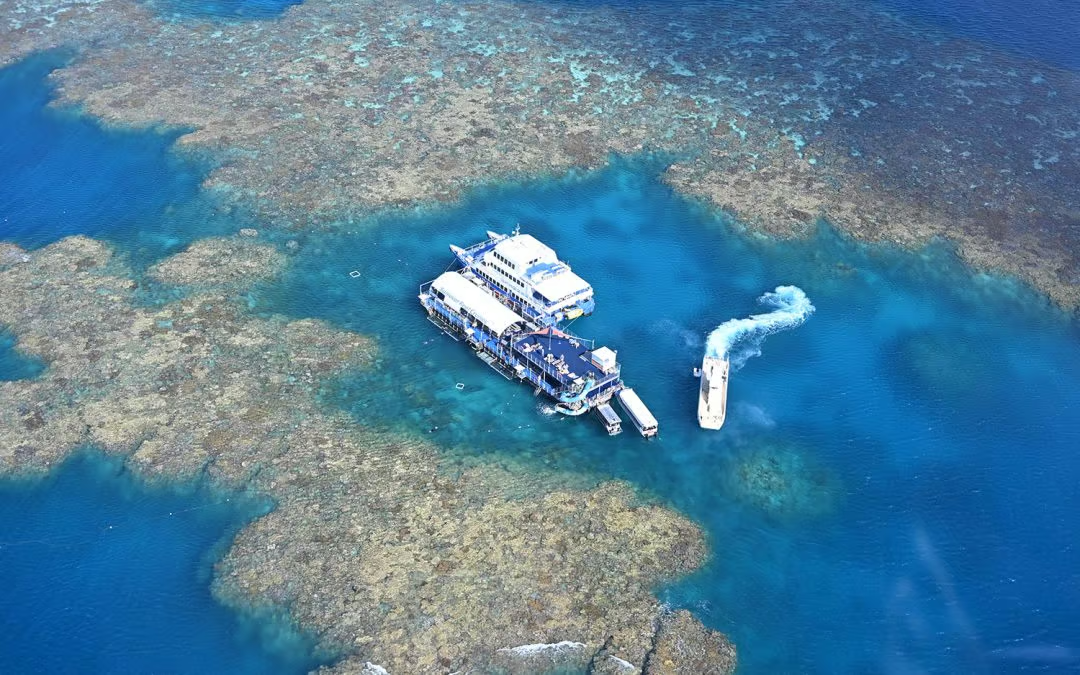
Running it as real fieldwork at Moore Reef
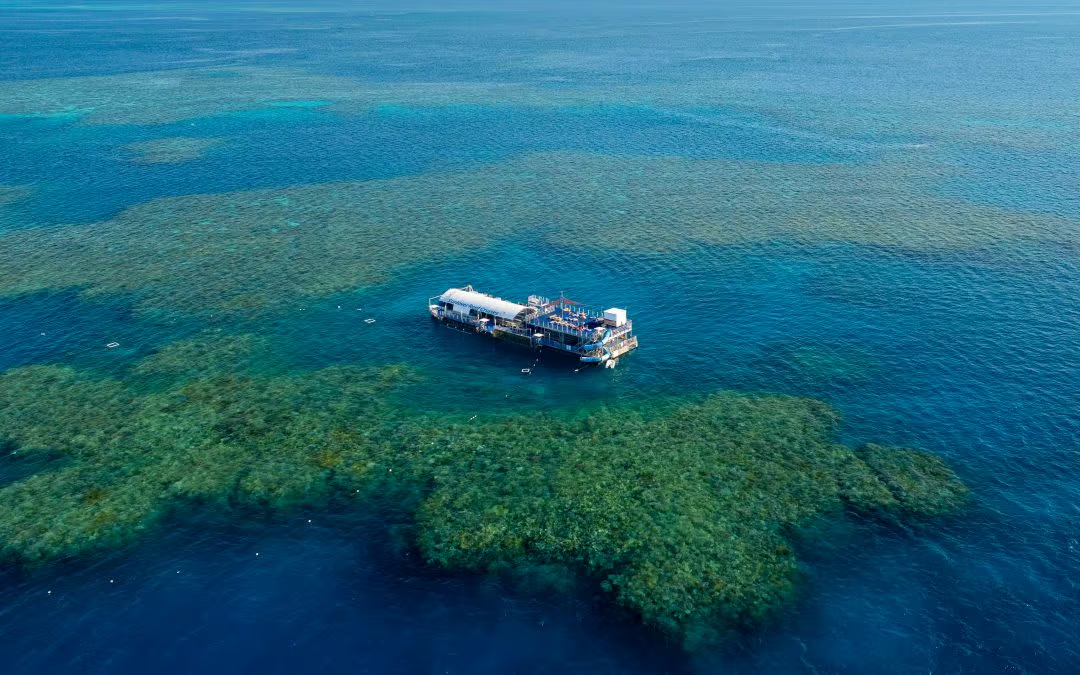
We built a program specifically around this syllabus point, and it is run by qualified marine biologists using the same techniques they use for their own data collection.
Part one: a one-hour incursion at school
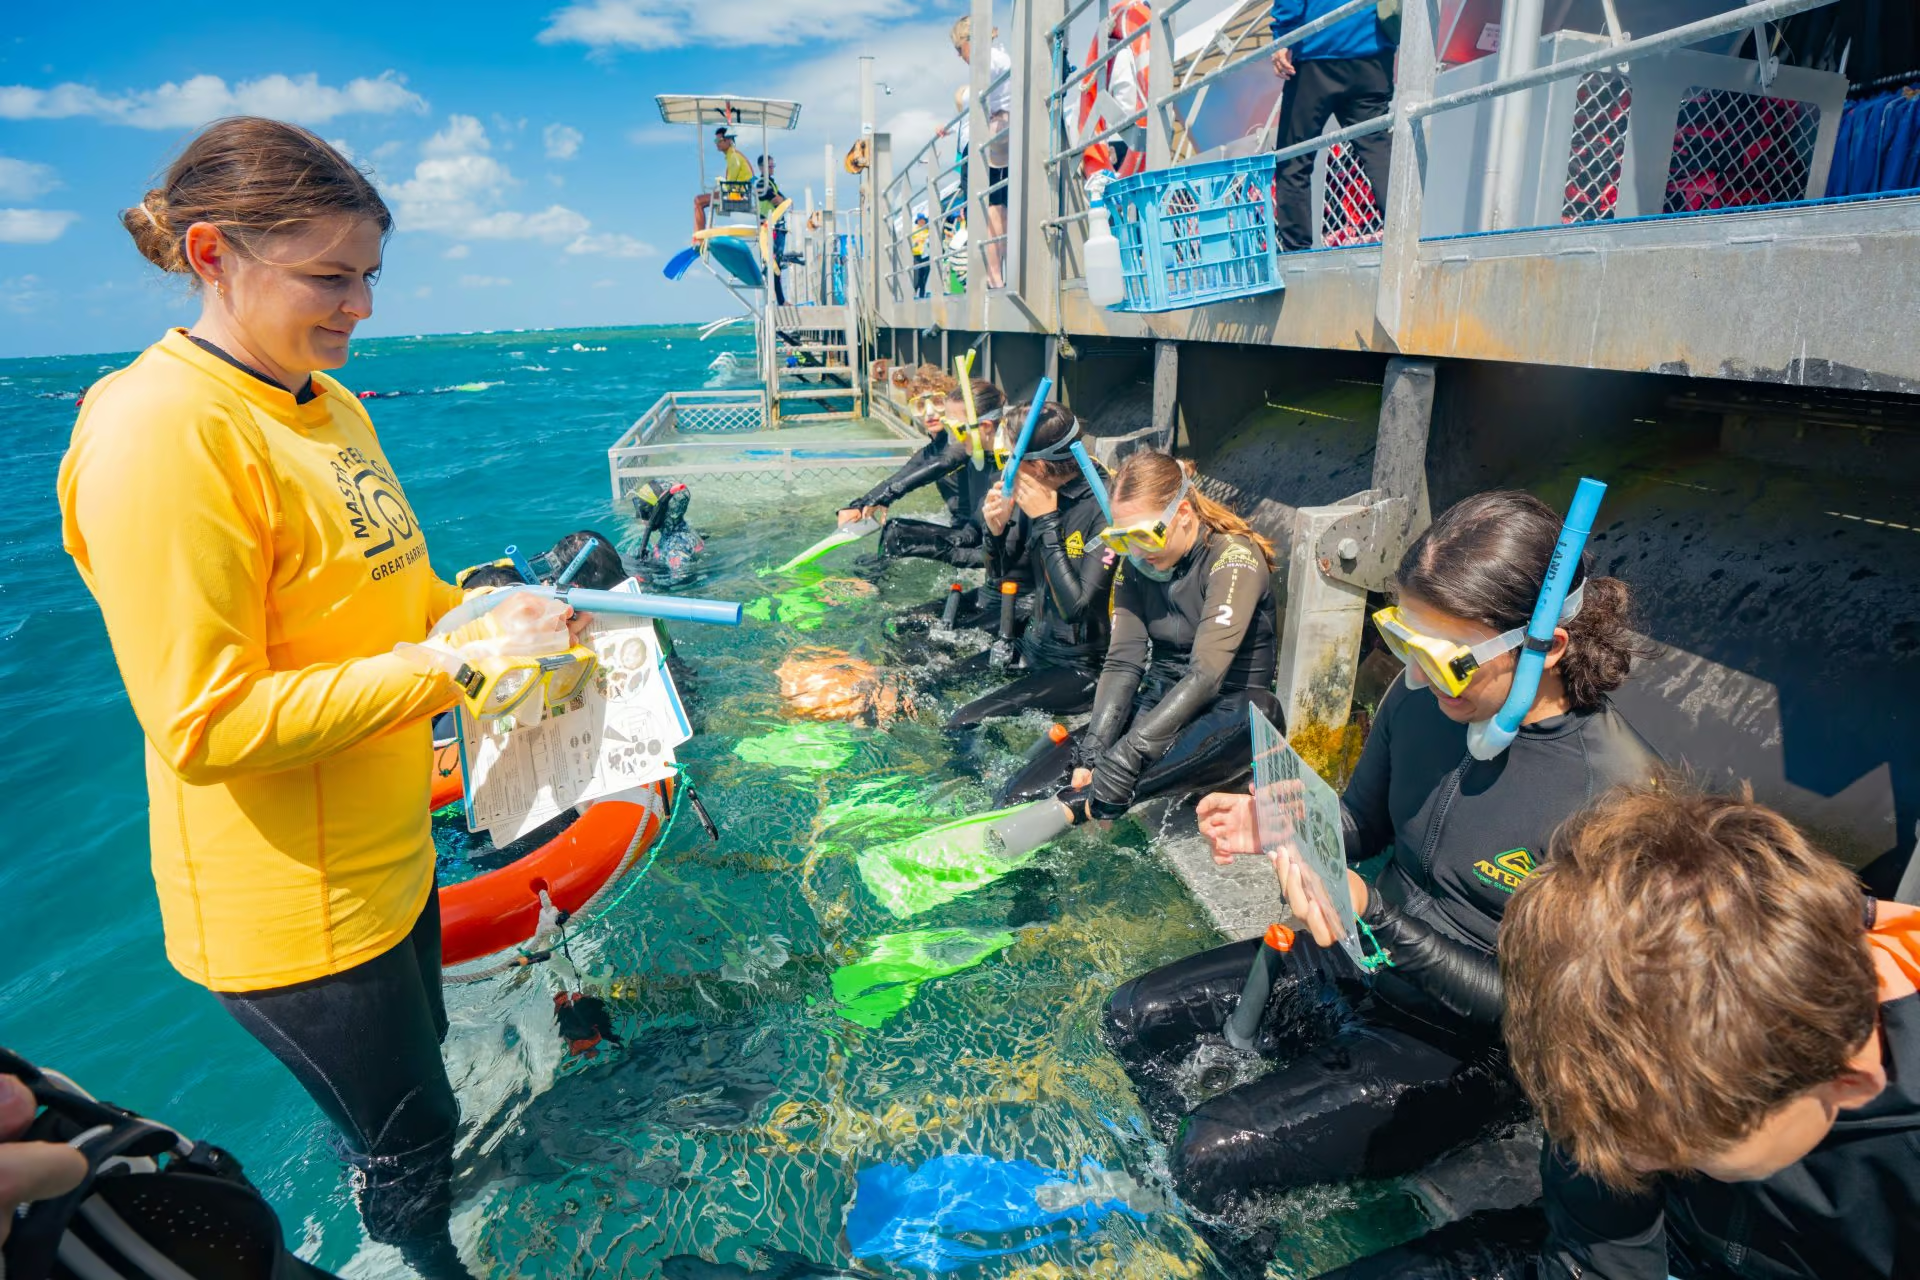
Before anyone gets in the water, we come to the classroom. Students learn what the fish actually look like, get taught practical strategies for counting them, and run a couple of practice counts using video. Then they work the maths on a real example, so the calculation is familiar before the data is theirs.
Part two: a full day at Moore Reef
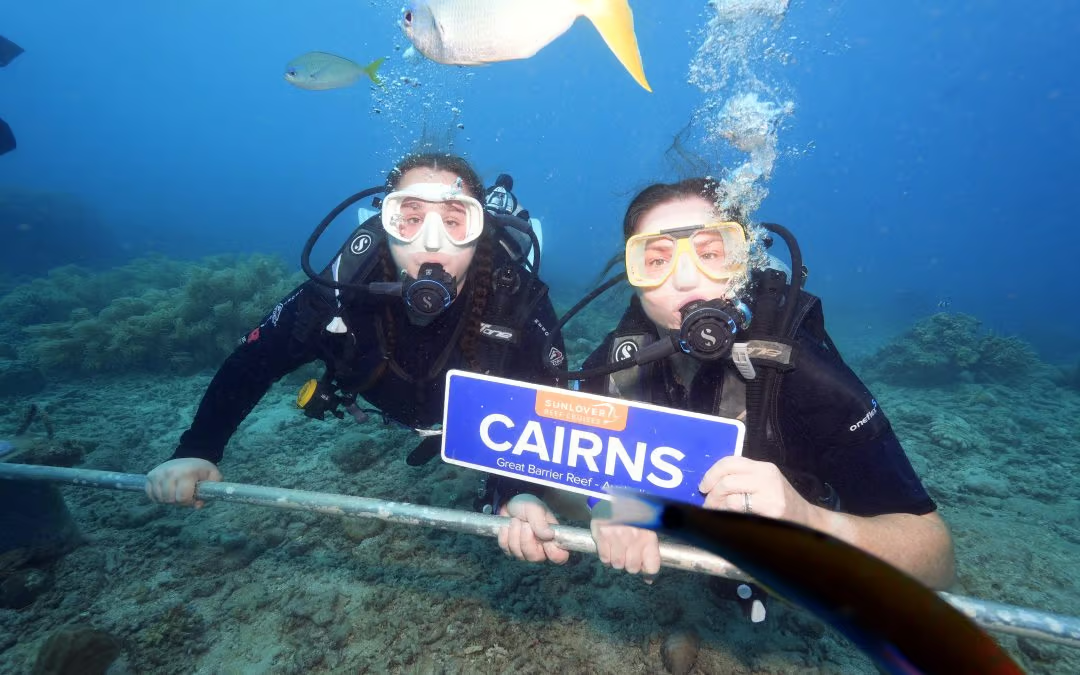
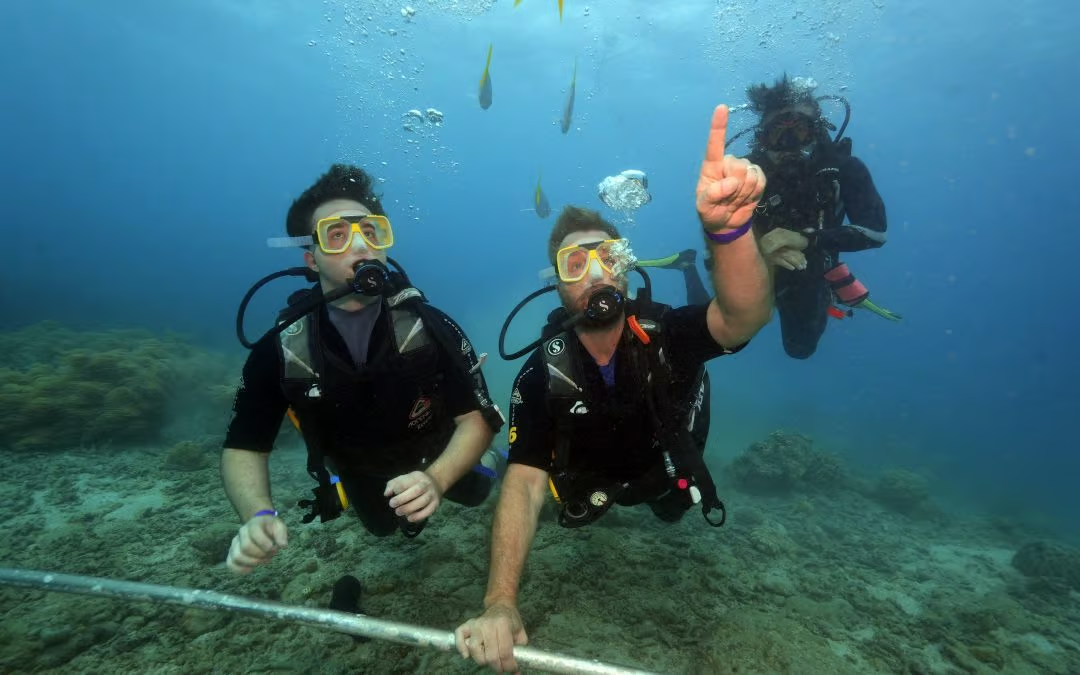
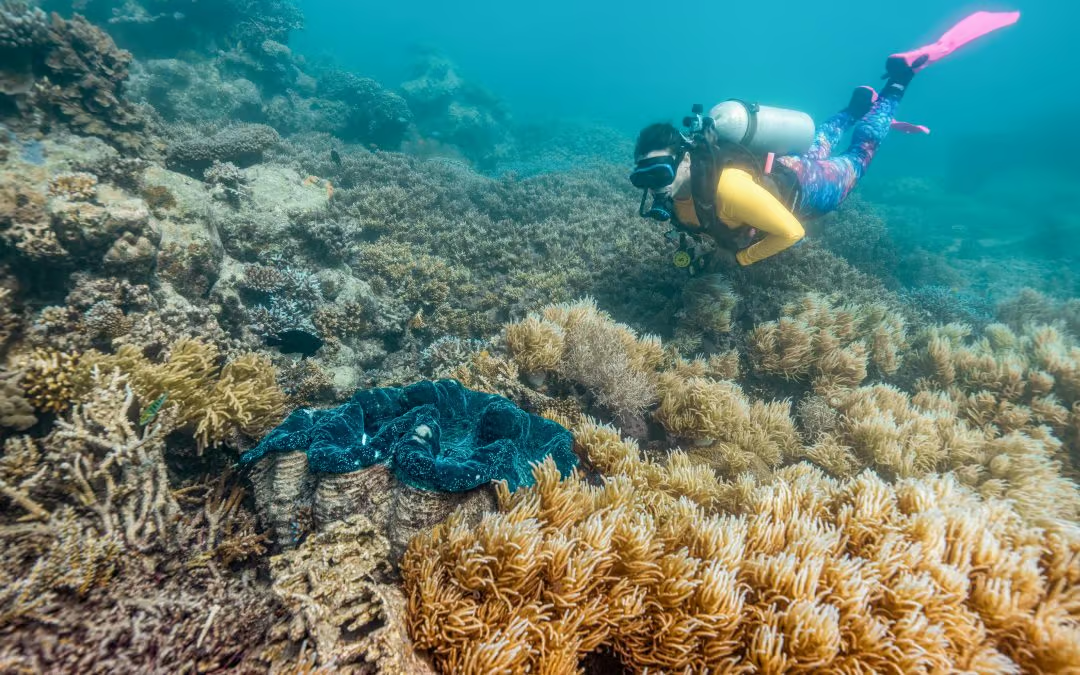
On the reef, students get a 45-minute snorkel tour and split into groups of six. Each group has time to get familiar with the fish before starting, then runs its own counting session along a belt transect three metres wide. Every student is given a specific size range of fish to count, which is what makes it achievable — there are a lot of fish out there.
Evenness, taught in the water
While they are counting, students see why some species turn up in tens and others as a single individual — why predators sit at low numbers and why schooling species dominate a tally. Evenness stops being a definition and becomes something they watched happen.
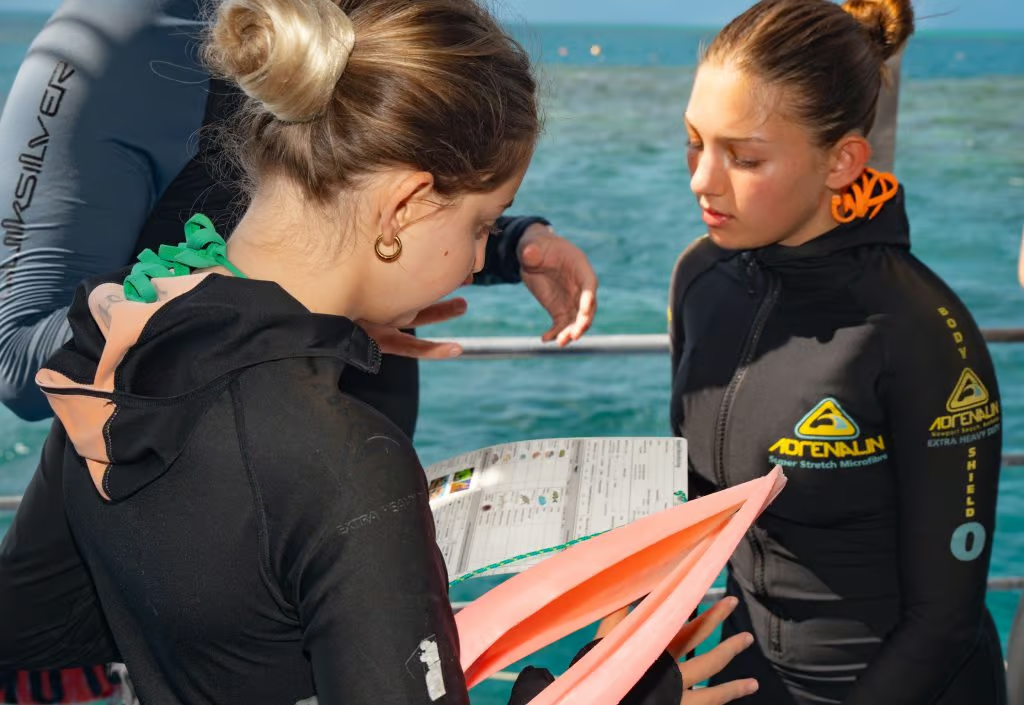
The worksheet
It all comes back to a worksheet that pairs the practical work with the calculations, so students practise the exact skill the external exam asks for, using data they collected themselves.
Full details are on our school excursions page.
Funding for Queensland schools
Because the program is curriculum aligned, it is eligible under the Queensland Government’s Great Barrier Reef Education Experience Program, which exists to help Queensland students visit and learn about the Reef. Eligibility and funding rounds are set by the department, so check the current criteria on their page before you plan a trip around it.
Common questions
What is Simpson’s Diversity Index?
A measure of biodiversity that combines species richness and species evenness into a single value. Using the Queensland syllabus formula, SDI = 1 − ( Σn(n−1) ÷ N(N−1) ), the result falls between 0 and 1, and a higher number indicates greater diversity. It can be read as the probability that two individuals selected at random from the community belong to different species.
What do n and N stand for?
n is the number of individuals of one particular species. N is the total number of individuals of all species combined in the sample. N is not the number of species — confusing the two is the most common error in the calculation.
Why do you subtract from 1?
The fraction on its own is Simpson’s Index (D), which measures dominance — the probability that two randomly chosen individuals are the same species. A higher D means a less diverse community, which is counterintuitive. Subtracting from 1 reverses the direction so that a higher number means greater diversity.
What is a good Simpson’s Diversity Index value?
There is no universal threshold. The index is designed for comparison — between sites, habitats, or the same site over time, sampled with the same method and effort. A value of 0.8 at one reef site only means something useful when set against a comparable figure from somewhere or sometime else.
What is the difference between species richness and diversity?
Richness is just the number of species present. Diversity accounts for richness and evenness together. Two sites can have identical richness but very different diversity if one is dominated by a single abundant species — as the two worked examples above show, producing 0.66 and 0.84 from the same six species and the same 80 individuals.
Can Simpson’s Diversity Index be used with percentage cover?
Not with this formula. The n(n−1) form counts discrete individuals, so it suits animals such as reef fish. For organisms measured as cover — hard coral, algae, seagrass — percentage cover and percentage frequency are the appropriate measures.
How is the data collected on a reef?
By belt transect. A measured line is laid along the habitat and everything within a set width of it — three metres in our program — is counted on a single steady pass. Observers are usually split by species size class so the workload is manageable and individuals are less likely to be counted twice.
Does this program suit Queensland Senior Biology Unit 3?
Yes — it was designed around that syllabus point. It covers species richness, evenness or relative species abundance, and Simpson’s Diversity Index, with students generating their own data and then working the calculation on it. Because it is curriculum aligned, it is also eligible under the Great Barrier Reef Education Experience Program.
The takeaway
Simpson’s Diversity Index is not difficult arithmetic. What makes it worth teaching is that it forces a genuinely ecological idea into a number: that a community of six species is not one thing, and that how the individuals are distributed among those species matters as much as how many species there are.
Students get that fastest when the data is theirs. Counting a school of chromis, then a single coral trout, then watching those numbers pull the index in opposite directions, does something a worksheet alone cannot.
Written by the team at Sunlover Reef Cruises, who run curriculum-aligned marine science programs to Moore Reef on the outer Great Barrier Reef with marine biologists on board. The worked examples on this page are illustrative datasets for teaching the calculation, not survey results from a particular site.